Gridding the Reference Flight
Open QGIS and open a “New Project”
Go to the “Layer” tab at the top, then “Add Raster Layer” - where it says browse, go to the Pix4D folder for the date and field being gridded and find the orthomosaic tiff file from your date of interest
Go to Project -> Properties. Select CRS from the side tab. Change the Coordinate Reference System to “WGS 84/ UTM zone 15N” Authority ID: “EPSG:32615”
Save project as Date_camera_field_QGIS
When the orthomosaic shows up on the screen, go to the “Rotation” bar in the bottom right corner and change the rotation angle until the orthomosaic is straight (As straight as it can be, doesn’t have to be perfect)
To create the origin point where the grid will start from:
Navigate to the “Layer” tab at the top of toolbar then “Create Layer” then “New Shapefile Layer”
Save with the name “origin”
Change the project CRS to EPSG:32615-WGS 84/UTM zone 15N Click ok
Click the “Toggle Editing” and then “Add Point Feature” (dot and three stars icon at top of page) - make the point in the lower left corner above the GCP in between the plants in the first experimental plot
When the labeling window comes up, name the point “1”
To get to the processing toolbox:
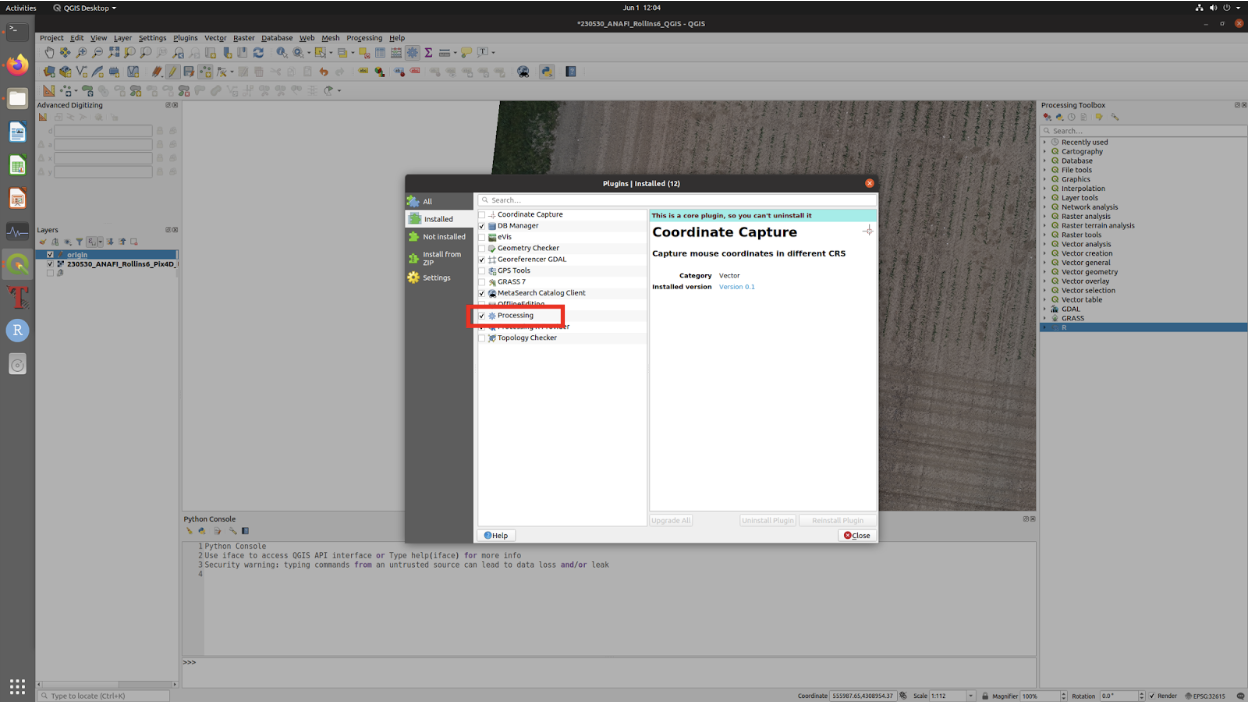
Go to “Plugins” then “Manage and Install Plugins”
Re-check the box for “Processing”
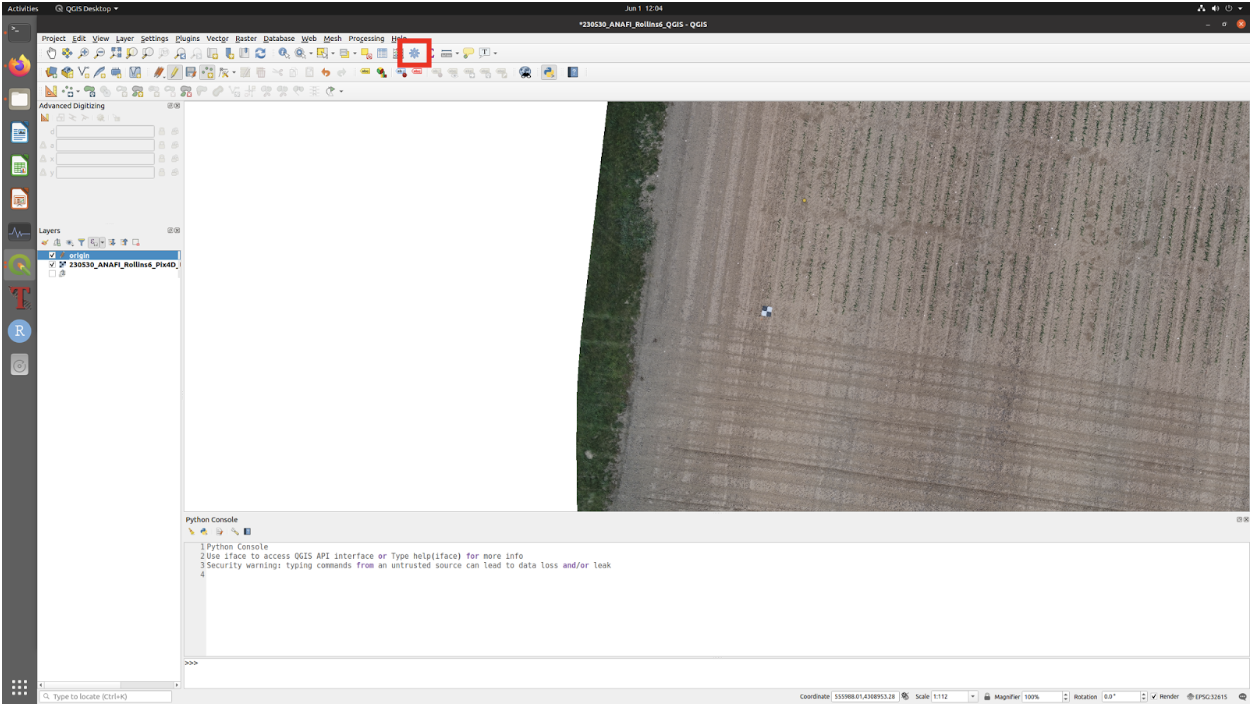
Close the tab and click on the “Setting” icon that looks like a gear and the toolbox will appear
Click on the “R” option and in the drop down menu click “Draw Plots from points” - a window should appear with all of the options for inputting the range and row measurements. To create the grid:
Based on information from the field map given, enter the number of ranges in the box for “Number of ranges per block” and enter the number of rows in the box for “Number of rows per block”
In the angle of rotation, enter the opposite (+/-) number of the rotation the orthomosaic is set at, which can be seen in the bottom right corner of the screen
Make the measurement unit for plot size “feet” and the ID format “serpentine”
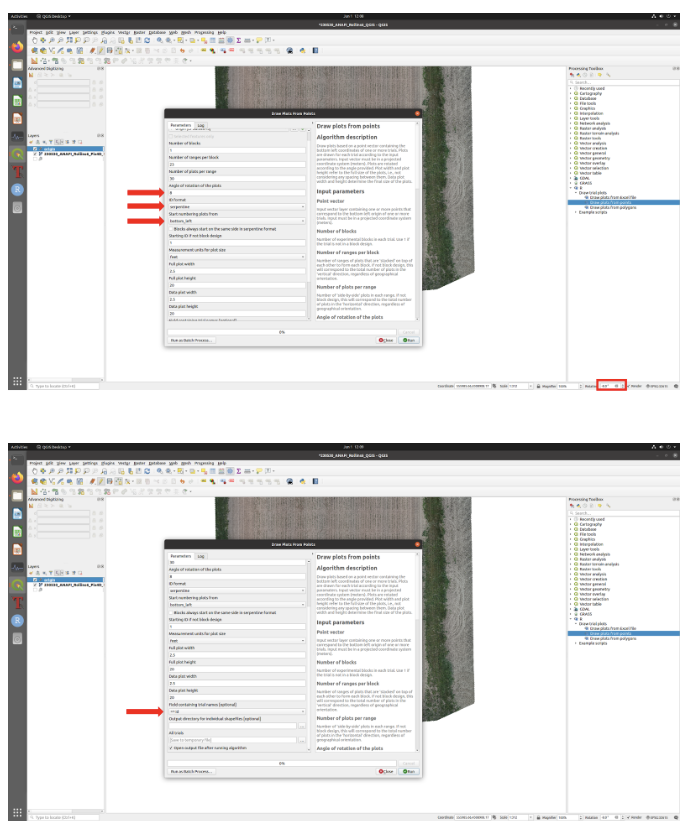
Start the numbering plots should be “bottom left”
The “Full plot height” and “Data plot height” should be the length of each plot in feet and the “Full plot width” and “Data plot width” should be the width of each plot in feet
Set the Field containing ID to “123 id” (a common error with the script happens when this setting isn’t correct)
11. Go to the log tab at the top of the window to see if the script runs successfully
12. When the script is finished running, the grid will generate on top of the orthomosaic with the boxes colored in. To make the boxes transparent:
Click on the layer in the “Layers” Menu on the left side of the screen
In the dropdown menu, go to “Properties” then “Symbology” on the left side of the window
Change the fill to the red outline
Click on the “Simple Line” below “Fill” and change the line width to “Hairline”
Click “Ok”
13. Go through each row of the grid checking that each box contains one plot - the plots on the end of each row and range don’t need a box because they’re border - so when the grid is used for future flights the plots will, for the most part, already be lined up (This step will probably take the longest)
14. Turn off toggle editing on the Trial grid layer
15. Export the reference grid for future use (***THIS MUST HAPPEN EVEN IF THE GRID ISN’T FINISHED…YOU WILL DELETE EVERYTHING IF NOT DONE!!!!!!!!)
Select the grid (“All trials”) from the layers toolbar on the left
Right click on the grid and go to Export -> Save Feature As…
Select the “GeoPackage” as the format
Select the “...” button and navigate to the main directory for this field (i.e., Gen7)
Name the file as “Reference_grid_[Field Name]_[Year]”. Click Save. Click Ok.
HOW TO OPEN THE FILES AND START ALTERING THE GRID AGAIN AFTER INITIAL CLOSING AND SAVING
Open QGIS
Project -> Open… -> select the project from the date of interest .qgz (this will only open the orthomosaic)
Layer -> Add Layer -> Add Vector Layer
- Choose the Reference_grid_“field”_“date”
Enable Toggle editing on the Reference grid layer
- Right click -> Properties -> symbology change the grid to red outline and change the line weight to hairline
Resume fixing the grid