- An image is replicated 5 times by our RedEdge camera, meaning that there is an image taken of the same exact thing for each band. The orthomosaic (when produced by agisoft) is a stacked version of these five bands that is adjusted so that we perceive it normally RGB/visible bands (when in Pix4D…no RE/NIR)

- Import all bands (.TIFF) for the date of interest from the Pix4D 04_indice->reflectance folder
- Import the grid as a .geopkg
- Rename them as Red, Green, Blue, NIR, RE (do not mix them up during this process the indice values will end up being incorrect

- In order to calculate an indice in QGIS you will need to know the mathematical formula for the indice. A good resource for finding this is: https://www.nv5geospatialsoftware.com/docs/BroadbandGreenness.html
- For this example, we will be using NDVI and GSAVI (this site also provides the sources for the indices for easy citation in papers)
- In our images we have pixels, and each pixel has a value in each band
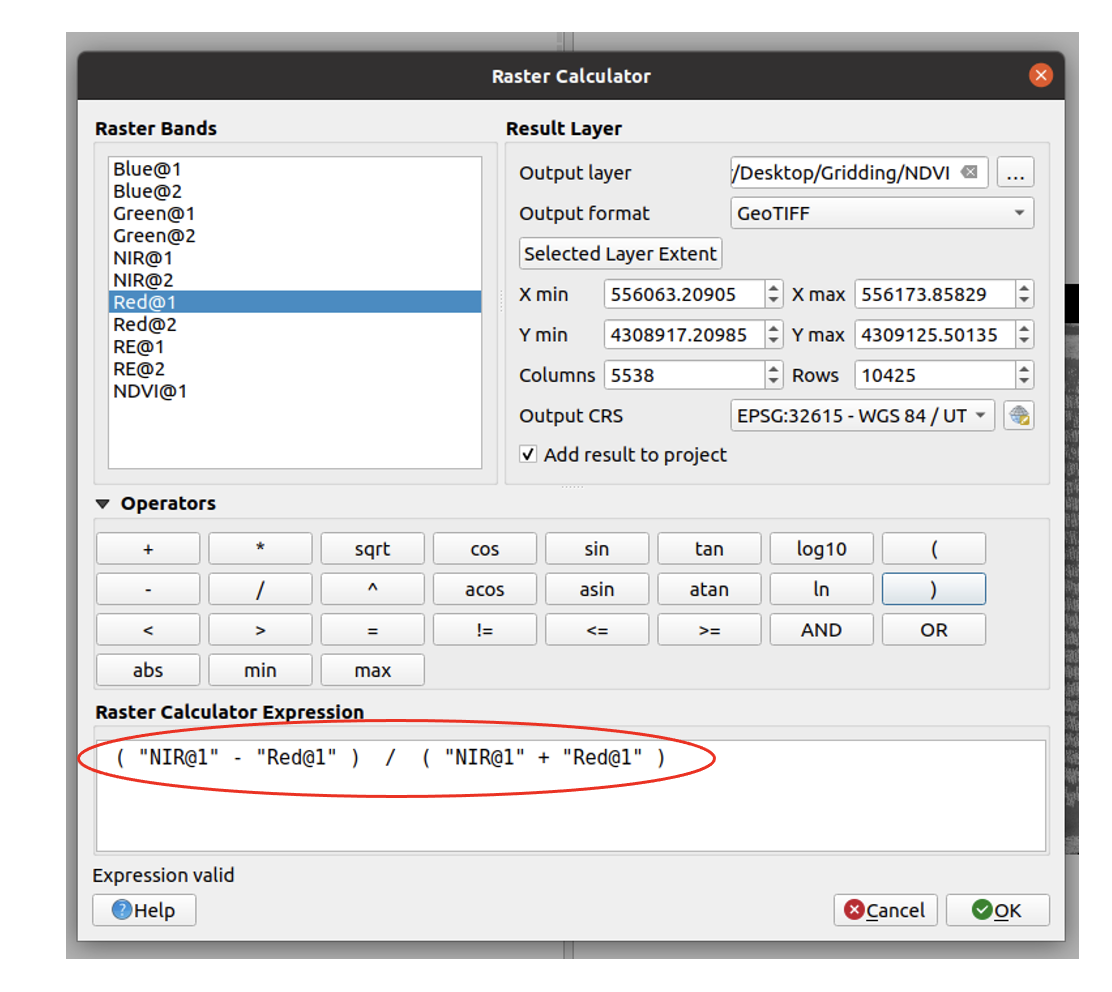
- In order to calculate the NDVI of the whole image we will use the raster calculator option in QGIS and type in the NDVI equation (NIR-Red)/(NIR+Red). (Make sure that you use the names of the bands with values that you are using and thee keypad on the screen)

- GSAVI = (1.5*(NIR-GREEN))/(NIR+GREEN+0.5)

- GSAVI > 0.2 = mask (figure out how to do the thresholding for soil removal process)
- NDVI*GSAVI = NDVI_V
- (NDVI_V*NDVI_V)/NDVI_V = final_NDVI
- The equation in red above allows for the soil to be considered N/A values…which we need in order to take plot means and medians (or other measures)
(0+0+0+0+0.8+0.7+0.8+0.7)/8 = 0.37
(N/A+N/A+N/A+N/A+0.8+0.7+0.8+0.7)/8 = 0.7
